Executive Summary:
- Developed international equities rebounded strongly in Q2, with MSCI EAFE up 11.1% and first-half returns reaching 9.8%.
- Growth led the recovery, driven by Information Technology and AI infrastructure earnings momentum; value lagged and Energy reversed after prior-quarter leadership.
- Market breadth remained narrow, international valuations stayed elevated, and EAFE earnings growth expectations continued to trail the U.S.
- Key focus: whether recent momentum-led gains broaden across regions and sectors into more durable leadership.
- Global growth remains uneven, balancing resilient investment activity against renewed inflation pressure.
- The U.S. remains the strongest major economy, supported by business investment, AI infrastructure, reshoring, and industrial spending.
- Europe’s outlook is stabilizing but fragile, with modest PMI and GDP improvement offset by renewed inflation risk, elevated energy costs, weak German industrial momentum, fiscal pressure in France and the UK, and rising ECB tightening risk.
- Canada’s recovery remains weak and trade-policy dependent, while Europe is stabilizing but constrained by energy costs, fiscal strain, Chinese competition, and ECB caution.
- Japan and Australia face policy-sensitive inflation dynamics; China’s export-led growth is increasingly pressured by geopolitical friction and weak domestic demand.
- Elevated energy prices, tariffs, Middle East risk, and trade fragmentation favor high-quality companies with durable competitive positioning.
Economic and Capital Markets Commentary
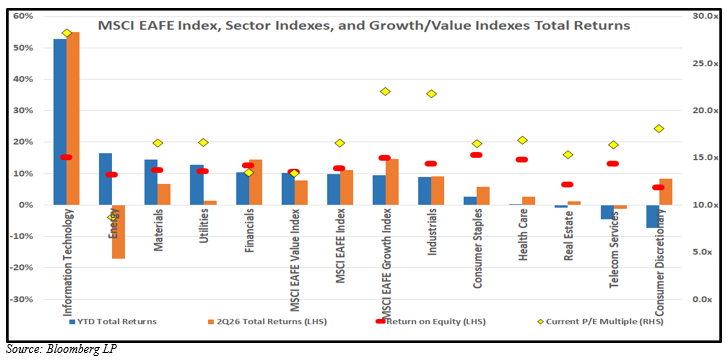
Within the EAFE family of indexes, growth stocks surged during the quarter. The MSCI EAFE Growth outperformed with a total return of 14.7%, exceeding the MSCI EAFE Value Index’s 7.8% by 690bps. Quality performed in line with the growth index, with the MSCI Quality Price Index returning 14.1% during the quarter. Despite the leadership this quarter, all sub-indexes (growth, value, quality) performed within 100bps of one another for the first six months, with the MSCI EAFE Index returning 9.8%.
The chart below shows the sector-performance, and Information Technology is the clear beneficiary of the momentum led rebound for this index. Energy, which led in the prior quarter, reversed course to be the poorest-returning sector on the prospects of lower energy prices and an extended ceasefire. Financials was the only other sector to outperform the broad index during the quarter, while all others underperformed.
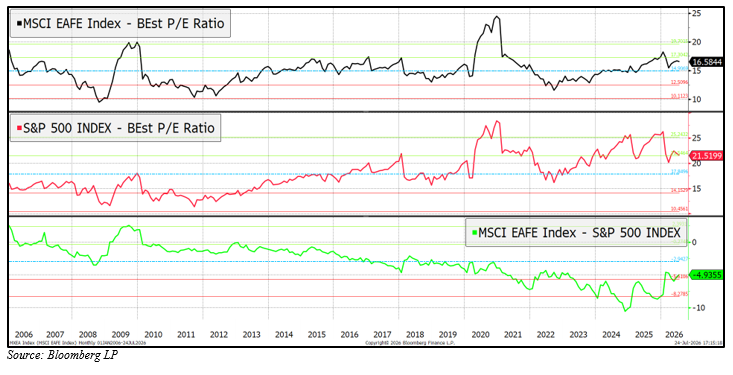
Valuation multiples for international companies in the index remain historically elevated, sitting nearly one standard deviation above their 20-year average. Buoyant global equity markets and ample liquidity have supported international valuations, and despite higher multiples, they retain a consistent discount to domestic U.S. equity valuations. Greater earnings growth, currently supported by greater exposure to artificial intelligence and technology infrastructure, supports the premium for the U.S. index. EPS growth for the S&P 500 Index is expected to be ~3x faster than the MSCI EAFE Index in 2026. While 2026 growth is cyclically high, the spread in growth rates remains consistent with the median growth rates from 2017-2026, excluding volatile COVID years (2020-2021): 10.2% versus 3.0%. Current estimates for MSCI EAFE Index EPS growth are still a strong 12.8% for 2026, supported by strength in capital goods and AI infrastructure (e.g., semiconductors).
North America
The U.S. economic expansion remains resilient despite more restrictive monetary policy, elevated geopolitical uncertainty, and inflation above the Federal Reserve’s target. Growth has moderated from the post-pandemic rebound, but real GDP, payroll growth, and business confidence still point to an economy expanding from a position of strength. Real GDP expanded at a 2.1% annualized rate in the first quarter, payroll growth has strengthened, and business confidence has held up better than expected.
The key distinction in this cycle is that business investment – not housing, consumer borrowing, or easy financial conditions – has become the primary engine of economic growth. AI infrastructure, reshoring, automation, manufacturing, and critical infrastructure spending support employment and broadening demand across industries, although inflation and financial conditions remain important constraints. The AI buildout has broadened beyond semiconductors, increasing demand across electrical equipment, industrial automation, engineering, construction, power generation, and transportation.
Inflation remains a principal challenge. Higher energy prices, tariff-related cost increases, and shortages tied to the rapid AI infrastructure buildout have interrupted the disinflationary trend. However, these are not currently viewed as broad inflation that would typically require a significantly tighter monetary policy response. As a result, the Federal Reserve is likely to maintain current interest rates, especially if long-term inflation expectations remain anchored.
Canada’s economy enters H2 2026 with expectations for a weak recovery after contracting in both Q4 2025 and Q1 2026. Flash GDP estimates edged up 0.5% in April and further 0.1% gain in May, suggesting a Q2 rebound is underway. Bank of Canada has cut its full-year 2026 real GDP growth forecast to just 0.7%, consistent with the Bloomberg consensus – the weakest annual pace since 2015 outside of the pandemic.
The Bank of Canada held its policy rate at 2.25% at both its June and July meetings, with Governor Macklem signaling that current settings remain appropriate but that he wants to see excess supply absorbed before shifting stance. Markets expect the rate to remain on hold through year-end. On the inflation front, core CPI eased to below 2% for the first time in nearly six years, giving the Bank cover to remain patient. The dominant risk to the outlook is the U.S. trade policy. Prime Minister Carney has kept negotiating options open, telling provincial premiers that “everything’s on the table” if no agreement is reached, while the USMCA renewal remains the critical assumption underpinning most growth forecasts.
Western Europe
Europe enters H2 2026 in a precarious balancing act between a nascent growth recovery and a re-emerging threat of inflation that is forcing the ECB toward a tightening posture. The eurozone composite PMI returned to expansion at 51.9 in July – a five-month high – and Q2 GDP is forecast to show a 0.2% quarterly rebound, suggesting the bloc has stabilized after experiencing a soft patch. The ECB’s own June forecasts project full-year 2026 real GDP growth at 0.8% and inflation at 3.0%, both revised in the wrong direction from prior estimates. With Brent oil prices still elevated due to the conflict in the Middle East, those inflation projections may already be at risk of rising. The ECB held rates unchanged at July’s meeting after raising rates 25bps in June, but several Governing Council members have signaled that a September hike is likely. Beneath the surface, the structural picture remains challenging: Germany, the largest economy, will have anemic growth in 2026, the bloc faces a record trade imbalance with China that is hollowing out industrial competitiveness, energy costs are compressing manufacturing margins, and the geopolitical backdrop continues to inject uncertainty into an outlook that has very little buffer for further shocks.
Germany’s prospects for economic stabilization come after a bruising stretch, but the recovery remains fragile and heavily dependent on fiscal stimulus. Q1 2026 GDP grew 0.3% quarter-on-quarter – the strongest reading since early 2025. July’s composite PMI unexpectedly returned to expansion at 52.2, driven by a manufacturing rebound that was led, surprisingly, by the automotive sector. However, economists have cut their full-year 2026 real GDP growth forecast to just 0.6%, citing energy prices as the primary drag.
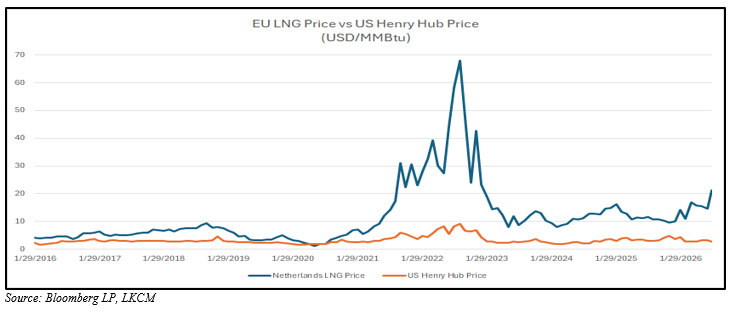
The energy price volatility is the single most consequential shift in Germany’s economic outlook. Germany, as Europe’s most energy-intensive industrial economy, is bearing the brunt. German power prices and natural gas prices have surged, directly compressing margins for energy-intensive manufacturers already under pressure. European gas storage stands at its weakest level since 2022 amid a global scramble for LNG supplies. Bund yields have risen to a 15-year high of 3.21% as markets price in further ECB tightening. Structural threats from Chinese imports are compounding the energy challenges. China’s trade surplus with Germany more than doubled year-on-year in June, and Chinese manufacturers are closing the quality gap on Germany’s famed Mittelstand, while offering much lower prices than German equivalents.
The pressure on German automotive OEMs is particularly relevant. Chinese brands now hold nearly one in ten passenger cars sold in Europe, outselling South Korean rivals on a quarterly basis for the first time, while, conversely, German luxury brands are losing ground in Chinese markets. Mercedes global deliveries fell 6% in Q1, with China sales down 27%. In late 2024, Volkswagen reached an agreement with unions to avoid plant closures in Germany through the end of the decade and to manage workforce reductions largely through attrition and voluntary measures. Yet, management is now considering closing plants in Hanover, Emden, Zwickau, and Audi’s Neckarsulm facility as part of a much larger restructuring plan. Berlin and Brussels have set an October deadline with Beijing to reset trade ties, and the EU is developing a “solidarity instrument” to support companies diversifying away from Chinese supply chains.
France’s economy is also navigating one of the most challenging stretches in over a decade. The Bloomberg consensus economic forecasts for full-year 2026 are for real GDP growth of just 0.6%. The Bank of France’s own forecast is even more cautious at 0.5%, marking the slowest pace of expansion outside of the volatile pandemic era.
The French economy contracted in Q1 2026, although it should narrowly avoid recession. Economists expect GDP to resume positive growth for the second quarter, driven by broad-based improvements in June activity. July PMI data offered further cautious optimism, with the composite reading rising to 49.6 from 47.2 in June, the closest to the 50 threshold for expansion since the commencement of the Iranian conflict. However, both manufacturing new orders and services remain in contraction. The fiscal picture remains a concern, as France will likely not meet its 2026 budget targets, citing energy cost overruns and elevated military spending. A recent finance ministry-commissioned report warned that Macron’s successor will need to find €126 billion in savings to stabilize debt; otherwise, the deficit is expected to swell to nearly 7% of GDP by 2030. On the labor market, unemployment is forecast to reach 8.2% in 2026, a seven-year high, compounding weak consumer confidence, while a fragmented political landscape heading into the presidential succession makes the prospect of meaningful fiscal consolidation or structural reform appear remote in the near term.
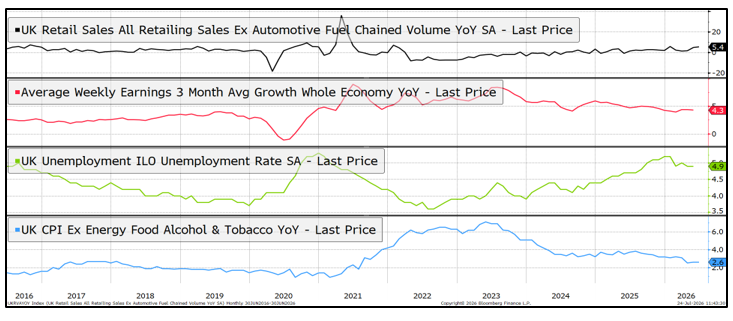
The UK economy exhibits tentative signs of a rebound, though its backdrop also remains fragile. July’s composite PMI jumped to a three-month high of 52.1 – well above the 49.8 consensus – supported by World Cup-related consumer activity, summer tourism, and favorable weather, with manufacturing new orders hitting their highest reading since February 2022. Retail sales also beat forecasts for a fifth consecutive month, rising 5.4% year-over-year in June. However, underlying conditions remain challenging, as public borrowing overshot OBR forecasts by £2.7 billion in the first three months of the fiscal year, wage growth is running at 4.0%, and the conflict has reignited inflation concerns, raising the probability of a Bank of England rate hike in September to ~67% and reversing a more accommodative rate policy trend.
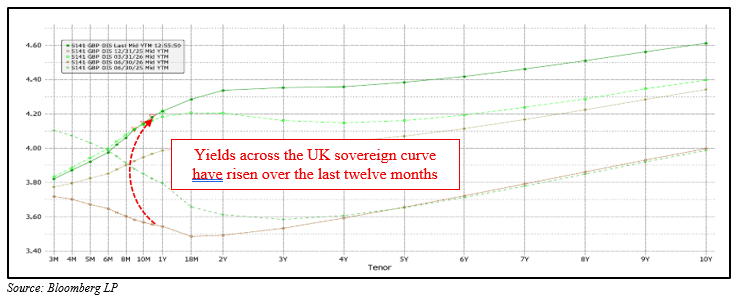
The UK is navigating its latest leadership transition after Keir Starmer resigned in late June following a sustained internal Labour rebellion, cabinet defections, and a collapse in political authority. Andy Burnham, the former Mayor of Greater Manchester, succeeded Starmer as Prime Minister on Monday, July 21, becoming Britain’s sixth prime minister in seven years. Burnham has moved quickly to assert control, signaling he will use “flexibility” within existing fiscal rules to push borrowing closer to its limits and is seeking to shift economic decision-making power toward Downing Street and away from the Treasury. This action has already resulted in internal tension, according to people familiar with the matter. Consumer confidence posted its largest single-month jump since November 2023, rising 6 points on “Burnham Bounce,” though risks from Middle East energy price pressures loom over the nascent optimism. Concerns over inflation, combined with increased fiscal deficits, have raised market rates higher across the yield curve. The UK enters the second half of 2026 with a fragile and contradictory economic footing: a tentative consumer-led rebound, buoyed by one-off factors, collides with a tightening rate cycle where markets now expect policy rate hikes, all against a backdrop of [another] new prime minister, weak fiscal conditions, and inflation risk.
Asia Pacific
Japan’s economy decelerated meaningfully from its 2025 pace. Real GDP growth slowed to +0.4% YoY in Q1 2026, down sharply from a peak of +1.9% in Q2 2025, reflecting softening domestic demand and global trade headwinds. The BOJ is reportedly considering raising its growth forecast from its current projection of 0.5% for the fiscal year ending March 2027, citing resilient export demand tied to AI infrastructure investment. Prime Minister Takaichi’s government unveiled a $2.3 trillion growth strategy in late June 2026, representing a significant shift in Japan’s fiscal and industrial policy.
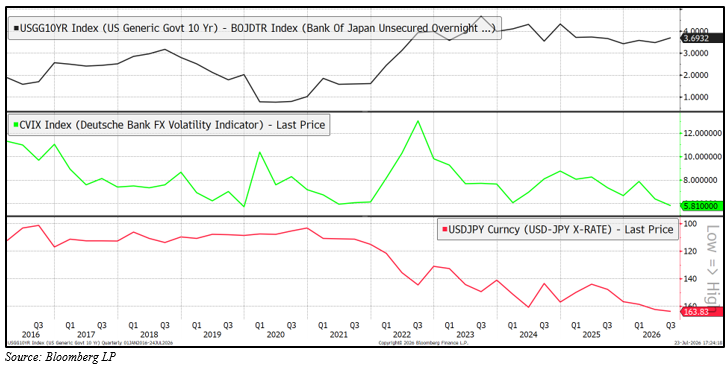
A persistent headwind is the yen’s broad-based weakness, with USD/JPY trading near 163 – a four-decade low – and the BOJ’s nominal effective exchange rate index hitting fresh record lows against a trade-weighted basket of currencies. Japan spent a record ~$74 billion in a single month to defend the yen in late April, but the effect proved short-lived. The weak yen is a double-edged dynamic. It supports export competitiveness while increasingly passing through import prices to consumers, adding pressure to household living costs and domestic consumption.
Headline CPI has eased from its January 2025 peak of 4.0% year-over-year to 1.5% as of May 2026, modestly below the BOJ’s 2% target. The 10-year breakeven inflation rate was approximately 2.0% on July 23, indicating that markets expect inflation to remain near target. Since ending negative rates in March 2024, the BOJ has raised its policy rate five times to 1.00%, the highest level since 1995, and is widely expected to hold rates steady at its next meeting.
Even after these increases, the yen carry trade remains in force. Hedge funds hold their most bearish yen positioning since 2007, supported by low FX volatility and a wide US-Japan rate differential. This combination has made the trade both attractive and self-reinforcing. A key risk to global markets is a rapid, disorderly unwind. If the BOJ tightens faster than markets expect, forced covering of short-yen positions could ripple across global risk assets, similar to the August 2024 episode. Resilient capital spending, manufacturing strength, and a more proactive fiscal agenda support growth. However, yen weakness, imported-cost pressures, and the risk of a disorderly carry-trade unwind leave the policy path unusually sensitive. The most likely outcome is continued, modest expansion with gradual policy normalization.
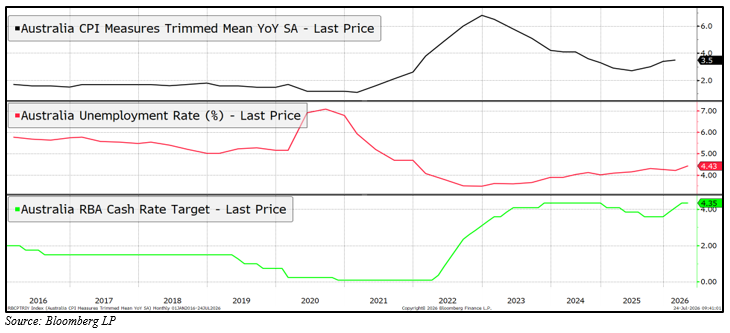
Australia’s economy has a challenging dynamic heading into the second half of 2026. Real GDP growth came in at just +0.3% QoQ in Q1 2026, well below expectations and roughly one-third the pace of Q4 2025. Household spending has become volatile over the last few months in the face of higher fuel costs and rising interest rates, though the OECD still projects full-year 2026 real GDP growth of 1.9%, broadly unchanged from 2025. Consumption may need to remain resilient to achieve these estimates. Fortunately, the labor market remains strong. Australia added more than five times consensus estimates in net new employment in June, with the unemployment rate holding at 4.4%.
The most significant development over the past quarter is the sharp reversal in the Royal Bank of Australia’s rate cycle. After cutting rates three times in 2025, the RBA has since reversed course entirely, hiking three times in 2026, returning the cash rate to 4.35% – or back to its prior cycle peak. Persistently elevated inflation prompted this pivot. The trimmed mean CPI held at 3.6% YoY in June, above the top of the RBA’s 2–3% target band for a seventh consecutive month. The consensus estimate for headline CPI has now risen to 4.1% – a full percentage point above estimates in January. The blowout jobs print has reinforced expectations of further rate hikes. The RBA has also communicated that the risk of inflation expectations becoming unanchored is “elevated,” and Middle East-driven energy price volatility adds an additional risk that complicates the path forward.
China’s economy continues to exhibit a pronounced K-shaped dynamic, with exports serving as the primary engine of growth while domestic demand remains subdued. Exports surged 19.4% year-over-year in May, driven in part by demand for semiconductors, which experienced an 111% annual increase in exports in May. Automobile exports also continued to surge, increasing 40% and supporting net export growth. Despite export strength, domestic demand for new cars has decreased by 22% this year, making the proliferation of auto OEMs dependent upon stealing market share in external markets. China’s full-year GDP came in at 5.0% for 2025, but the IMF currently projects a moderation to 4.6% in 2026 due to the weak domestic market. That export strength belies weakness at home. In May, retail sales posted their first year-over-year decline since the post-COVID reopening, falling 0.6%, while the property sector remains mired in a multi-year slump.
This export-led model is increasingly running into geopolitical friction. The U.S. reimposed tariffs of 12.5% on Chinese goods following a Supreme Court ruling that struck down earlier levies. In contrast, Europe – now China’s most critical alternative market after the U.S. tariff escalation – actively searches for new tools to counter what it now sees as a flood of subsidized Chinese imports displacing domestic industries. China’s trade surplus with the EU hit a record $32.9 billion in June alone, up 27% year-over-year, intensifying calls within the bloc for defensive measures. Beijing has responded in kind. China’s Commerce Ministry banned exports of dual-use items to 14 EU entities, including German defense company Rheinmetall, citing retaliation for EU sanctions. As both the U.S. and Europe harden their stances, the export channel that has been propping up Chinese growth faces mounting political headwinds, leaving policymakers with limited room to maneuver given the still-fragile state of domestic consumption and real estate.
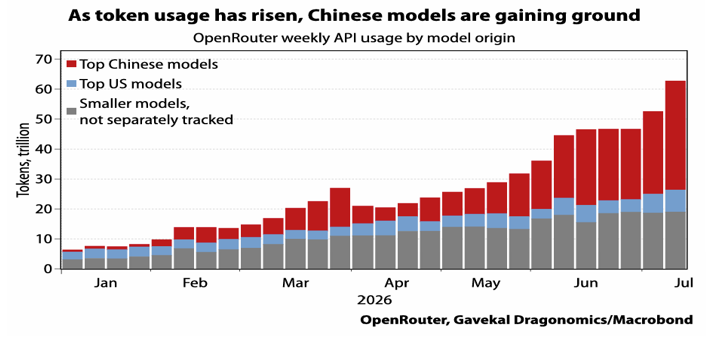
China’s rapidly expanding artificial intelligence sector presents a dual threat to global AI profitability: rapid model capability convergence and structurally lower token pricing. Chinese models now benchmark within ~6% of the U.S. frontier offerings, a record-low gap that has narrowed sharply over the past year. Average Chinese model token prices run approximately 86% below the U.S. equivalents, and open-weight models like Moonshot’s Kimi K3 allow enterprises to bypass token fees entirely. DeepSeek has also made initial deep discounts permanent and continues cutting token prices. The structural cost advantage is compounded by government-subsidized energy rates that give Chinese data center operators a material edge over the U.S. hyperscalers – a dynamic that, as LLM performance differences become imperceptible to average users, risks making token production cost the sole competitive differentiator. As this new technology rapidly evolves and additional supply rushes to market, investors will be watching carefully how capital returns endure against China’s aggressive industrial policy.
The most significant geopolitical risks to global economic growth are currently concentrated across three interlocking fault lines. The Iran conflict remains the most acute near-term threat, and recent Houthi attacks on Saudi oil tankers in the Red Sea pushed Brent crude above $100 a barrel before a partial retreat on renewed hopes [again] for US-Iran negotiations. Ceasefires with Iran are tenuous (to say the least) and any re-escalation risks a sustained energy price shock that would simultaneously hit growth and reignite inflation across every major economy. This new conflict overshadows a persistent strain from the Russian invasion of Ukraine. The increase in armed conflicts has heightened risks to global trade. Since 2014, deaths from armed conflicts have grown by more than 100% to 244,600 deaths while the conflict count increased by over 50% to 65 state-involved conflicts, according to the Uppsala Conflict Data Program. The U.S. tariff offensive represents the second major risk vector, as Trump imposed double-digit levies of 10–12.5% on 60 trading partners in late July. Trump threatened a “substantial tariff” on the EU over its fines on the U.S. technology companies, opening a new transatlantic front that compounds the existing EU-China trade tensions already impacting European industrial competitiveness. The third and more structural risk is the broader fragmentation of the global trading order. USMCA renewal negotiations have blown past their July deadline with no agreement in sight, and the EU and China are locked in retaliatory export control escalations. There is an elevated risk of a disorderly global trade, economic, or diplomatic rupture that could undermine current, consensus economic growth forecasts.
Mason D. King, CFA
August 10, 2026