Artificial Intelligence (AI) has been a major force shaping equity markets over the past two and a half years, but by late 2025, that momentum began to show signs of strain. Investor focus shifted toward the scale of AI-related capital spending required to sustain AI buildout, rising leverage, and elevated valuations. Those concerns intensified early this year as rapid advances in AI highlighted the potential for disruption across existing business models. The result was a meaningful repricing of various market segments along with a broader reassessment of the technology-led rally that had driven three consecutive years of double-digit returns.
Against this backdrop, the equity market declined in the first quarter, but the magnitude of the pullback was relatively modest given the volume of headline risk. Tariffs, Greenland sovereignty, Federal Reserve independence, and military activity in the Persian Gulf all weighed on investor sentiment. The peak-to-trough decline of the Standard & Poor’s 500 Index in the first quarter was 9.1%, below the average intra-year historical drawdown of nearly 14%. Beneath the surface, however, conditions were far more volatile, with sharp rotations across sectors and market capitalizations.
That shift in market leadership is occurring alongside a broader change in the macroeconomic backdrop. For much of the past three decades, monetary and fiscal policy have relied on supporting demand to stabilize the business cycle. That framework is becoming increasingly fragile as supply-side constraints tighten. Recent events in the Middle East highlight a system increasingly constrained by supply rather than demand.
The Middle East is not just an energy supplier but a critical hub for global trade. Disruptions to key transit routes ripple across natural gas, chemicals, fertilizers, and shipping, thereby raising costs and delaying production. What begins as a localized disruption can quickly evolve into a broader supply shock, reinforcing inflation and slowing economic activity.
THE ECONOMY
Entering the year, recession risk appeared relatively low, given underlying economic momentum and supportive policy conditions. The economy was supported by a 1.75% reduction in the Federal Funds rate over the past 18 months, lower taxes for many consumers and businesses via the One Big Beautiful Bill, and a data center-led technology capital investment cycle larger than the late 1990’s. As the second quarter begins, however, the odds of a recession have risen. Since 1973, all recessions have been preceded by an oil shock, except for the pandemic-induced recession.
In a world that consumes about 100 million barrels of crude oil and products each day, roughly 12-15 million barrels of production are currently stranded or shut in. The impact varies by region, with Asia and Europe more exposed than the U.S., given their reliance on imported energy. For example, almost 60% of Asia’s oil supply comes from the Middle East, which makes these economies much more sensitive to the current oil spike. In our view, the physical market for crude is likely tighter than the recent price increase in oil suggests, which would indicate underlying supply stress that may not yet be fully reflected in financial markets. These dynamics create a more complex and uneven global economic environment, where regional outcomes may diverge.
The good news for the U.S. economy is that energy intensity has declined meaningfully over time. Since 1980, the amount of oil required to generate a dollar of Gross Domestic Product has fallen by roughly two-thirds, reflecting a structural shift toward a service-dominant economy and improvements in energy efficiency. The rise of natural gas in power generation has also contributed to this decline. As a result, a $10/barrel increase in oil prices today has only a fraction of the macroeconomic impact that it would have had during the oil shocks of the 1970s.
However, despite the shale revolution making the U.S. a net energy exporter, energy still plays a critical role in the broader economy. While direct energy accounts for only 5-7% of the Personal Consumption Expenditures basket directly, this understates its broader role in transmitting inflationary pressures. The closure of the Strait of Hormuz has sidelined 20% of the global LNG supply, key fertilizer inputs, and a meaningful share of global helium used in semiconductor manufacturing. Rising gasoline, airfare, food, shipping, and electricity costs act as a tax on consumer purchasing power, eventually slowing demand and setting the stage for slower economic growth.
Rising oil prices are particularly challenging given the current inflation backdrop. The Federal Reserve’s preferred inflation gauge rose to 3.0% in February. Affordability was already set to be a central theme of midterm elections this fall, and rising gasoline prices only amplify the affordability issue for consumers. The cumulative effect of post-pandemic inflation has significantly reduced purchasing power for many households. For many families, especially those earning near the median, wage increases have not kept up with rising costs for housing, childcare, healthcare, and food. While higher-income households continue to spend, supported by asset appreciation, lower- and middle-income households rely on increasing debt and savings drawdowns to maintain consumption.
This divergence has created a “K-shaped” consumption pattern that sustains overall demand but increases financial vulnerability beneath the surface. The personal savings rate has declined to historically low levels, while credit delinquency metrics have begun to rise. These trends suggest that consumers’ resilience may not be as durable as the headline data suggests. Over time, this imbalance could lead to a sharper adjustment if economic conditions deteriorate.
Time is not on the economy’s side. If the Iranian conflict ends quickly, its economic effects might stay limited and temporary. But if it lasts into late summer or early fall, demand destruction is likely to become clearer. This process generally occurs in three stages. First, the spike in oil prices acts as a tax on households, prompting consumers to shift spending from other goods to offset rising energy costs. Around the same time, consumer confidence begins to decline. Ultimately, consumers reduce spending on dining out, travel, and shopping. Finally, consumers pause large-ticket purchases, such as cars and homes, which feeds back into the labor market.
MARKET
Several of the core assumptions underpinning the current bull market were stress-tested simultaneously in the first quarter. What began as an orderly rotation away from mega-cap technology and toward broader market participation evolved into something more disruptive. In March, the conflict in the Middle East delivered an energy supply shock. As a result, three themes defined the quarter: the AI creative destruction narrative, the rotation from software and services to physical infrastructure and tangible goods, and a renewed focus on energy.
Since early 2023, enthusiasm around AI has largely driven the advance in equities, with large-cap technology stocks at the center of that move. In fact, 10 stocks accounted for 55% of the Standard & Poor’s 500 Index’s return over the three years ended March 31, 2026. Only two of the ten stocks are not related to the AI theme in some way. That leadership began to fade late last year as investors reassessed the sustainability of returns on capital. A notable shift has emerged in how investors perceive AI, with markets increasingly viewing it through the lens of disruption rather than pure growth. AI is no longer treated solely as a tailwind but as a valuation filter applied across industries.
The shift has spread beyond technology into areas such as logistics, insurance, consumer finance, and commercial real estate. Businesses perceived as vulnerable to disruption have come under increasing scrutiny. Once a company is viewed as exposed, it becomes difficult to disprove that narrative in the near term. While some of these concerns will prove justified, others represent overreactions that create additional opportunities, although sentiment may take multiple quarters to recover.
Even before the Iran conflict, this disruptive view of AI influenced market leadership. Capital began rotating away from knowledge-intensive, asset-light business models toward more tangible, asset-heavy sectors, as evidenced by Industrials, Energy, and Materials being among the best-performing sectors through the end of February. This rotation reflects a broader change in how investors think about durability, pricing power, and long-term obsolescence risk.
Financial markets continue to be perceived as a constraint on policy. That dynamic was evident in April 2025 when tariffs on China approached 150%, and the resulting strain in the U.S. Treasury market forced a reversal. The dynamic reappeared in January this year, as a global rise in sovereign yields coincided with the escalation of rhetoric over Greenland. Policy can push markets until markets push back. When financial conditions tighten abruptly, whether through higher yields, reduced liquidity, or market volatility, the market assigns a price to a new policy course. The Treasury market, where 10-year Treasury yields have moved up towards 4.5%, now reflects the economic price of the Iran war. Recently, this threshold has proven to be an inflection point, leading to increased pressure on equity valuations.
Looking forward, bond yields should retreat once oil prices peak and supply pressures ease. In prior energy supply shock episodes, the peak-to-trough decline in yields occurred roughly a month after oil peaked: yields fell approximately 0.45% in 2022, 0.35% in 2023, and 0.20% in 1991. Lower yields should relieve downward pressure on stock valuations. Equities have cheapened as the forward P/E ratio on the Standard & Poor’s 500 Index has compressed from 22.3X at the beginning of the year to 19.4X and only 16.4X for the Equal Weight Standard & Poor’s 500 Index.
Corporate earnings expectations remain supportive for now. As we approach first-quarter earnings reports, analysts and companies are more optimistic than usual in their forecasts. Consequently, estimated earnings for the market in the first quarter are currently higher than expectations at the start of the quarter. The Standard & Poor’s 500 Index is on pace to achieve double-digit earnings growth for the sixth consecutive quarter. However, valuations and current earnings momentum tell only part of the story. The more crucial question is what will happen to estimates over the next two to three quarters. Earnings forecasts usually lead the broader economic environment by four to six months. In 2022, the equity market peaked in January, while earnings estimates kept rising before finally rolling over in June. With the Middle East conflict still unresolved and its economic effects ongoing, a similar pattern of delayed earnings downgrades cannot be ruled out.
CONCLUSION
Over the past five decades, oil shocks have tended to have a lingering effect. Investors tend to embed a persistent premium following supply disruption, and that dynamic is likely to repeat in the current cycle. Today’s oil prices reflect not only the immediate physical constraints on supply, but a broader and more durable repricing of geopolitical risk – one that is unlikely to fully unwind even if the conflict moves toward resolution. If the conflict persists, the current shortages affecting Asia will soon appear in Europe.
The Strait of Hormuz remains the single most important factor for markets to monitor. A credible path to reopening would help ease supply pressures, stabilize inflation expectations, and provide meaningful support to equities. A prolonged disruption, however, changes the calculus. Sustained closure would increase the risk of demand destruction and place the U.S. economy on recession watch. Simultaneously, sustained disclosure poses an existential risk to Iran. By that point, several Asian and European countries would likely already be experiencing economic contraction.
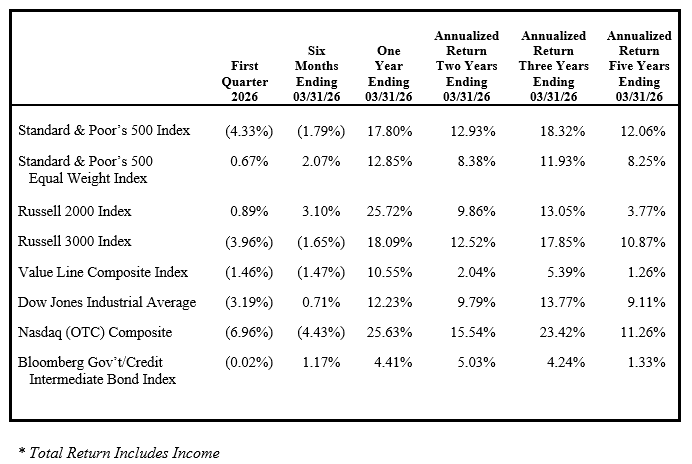
FINANCIAL MARKET TOTAL RETURN*
Michael C. Yeager, CFA
April 3, 2026
IMPORTANT INFORMATION
The commentary set forth herein represents the views of Luther King Capital Management and its investment professionals at the time indicated and is subject to change without notice. The commentary set forth herein was prepared by Luther King Capital Management based upon information that it believes to be reliable. Luther King Capital Management expressly disclaims any responsibility to update the commentary set forth herein for any events occurring after the date indicated herein or otherwise.
The commentary and other information set forth herein do not constitute an offer to sell, a solicitation to buy, or a recommendation for any security, nor do they constitute investment advice or an offer to provide investment advisory or other services by Luther King Capital Management. The commentary and other information contained herein shall not be construed as financial or investment advice on any matter set forth herein, and Luther King Capital Management expressly disclaims all liability in respect of any actions taken based on the commentary and information set forth herein.